> ## Documentation Index
> Fetch the complete documentation index at: https://docs.iroh.computer/llms.txt
> Use this file to discover all available pages before exploring further.
# Overview
> Monitor your network with comprehensive metrics collection
When you add endpoints to your network, various metrics are collected to help improve
performance and user experience.
Endpoints added to your network can opt-in to send these metrics to the Iroh
Services platform which will appear on the project dashboard.
## Project metrics
All endpoint metrics are aggregated at the project level, to provide insights
into overall network performance. This aggregated data helps in understanding
trends and patterns without exposing individual endpoint details.
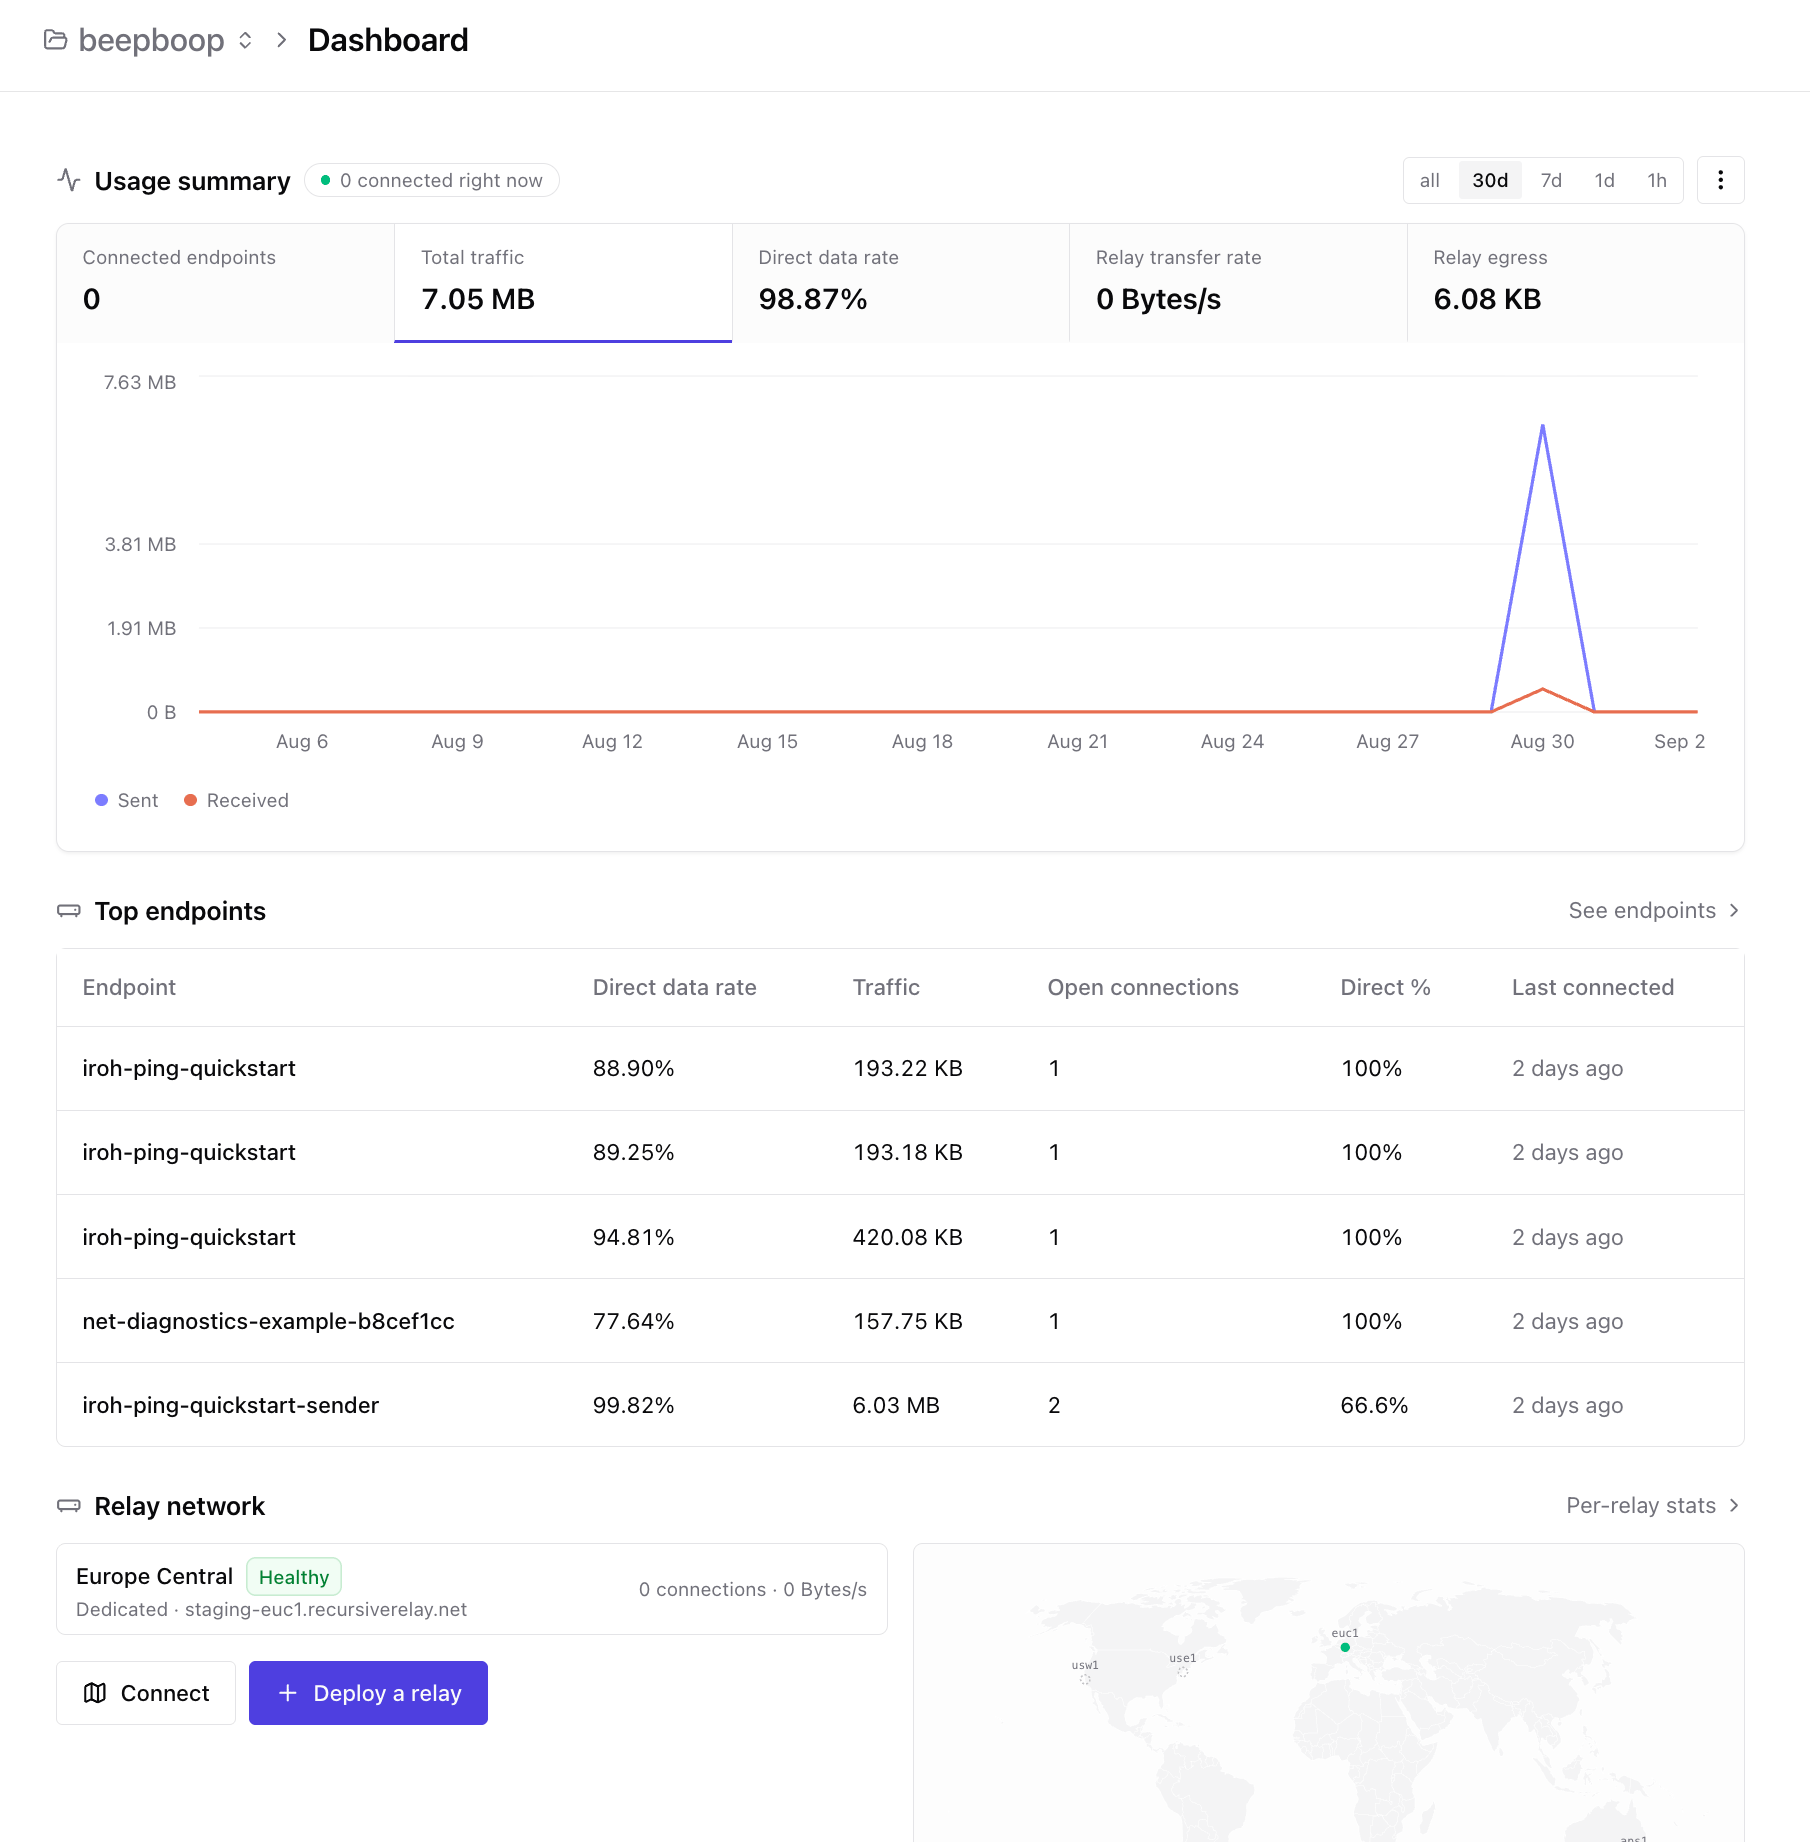
 ### Online Endpoints
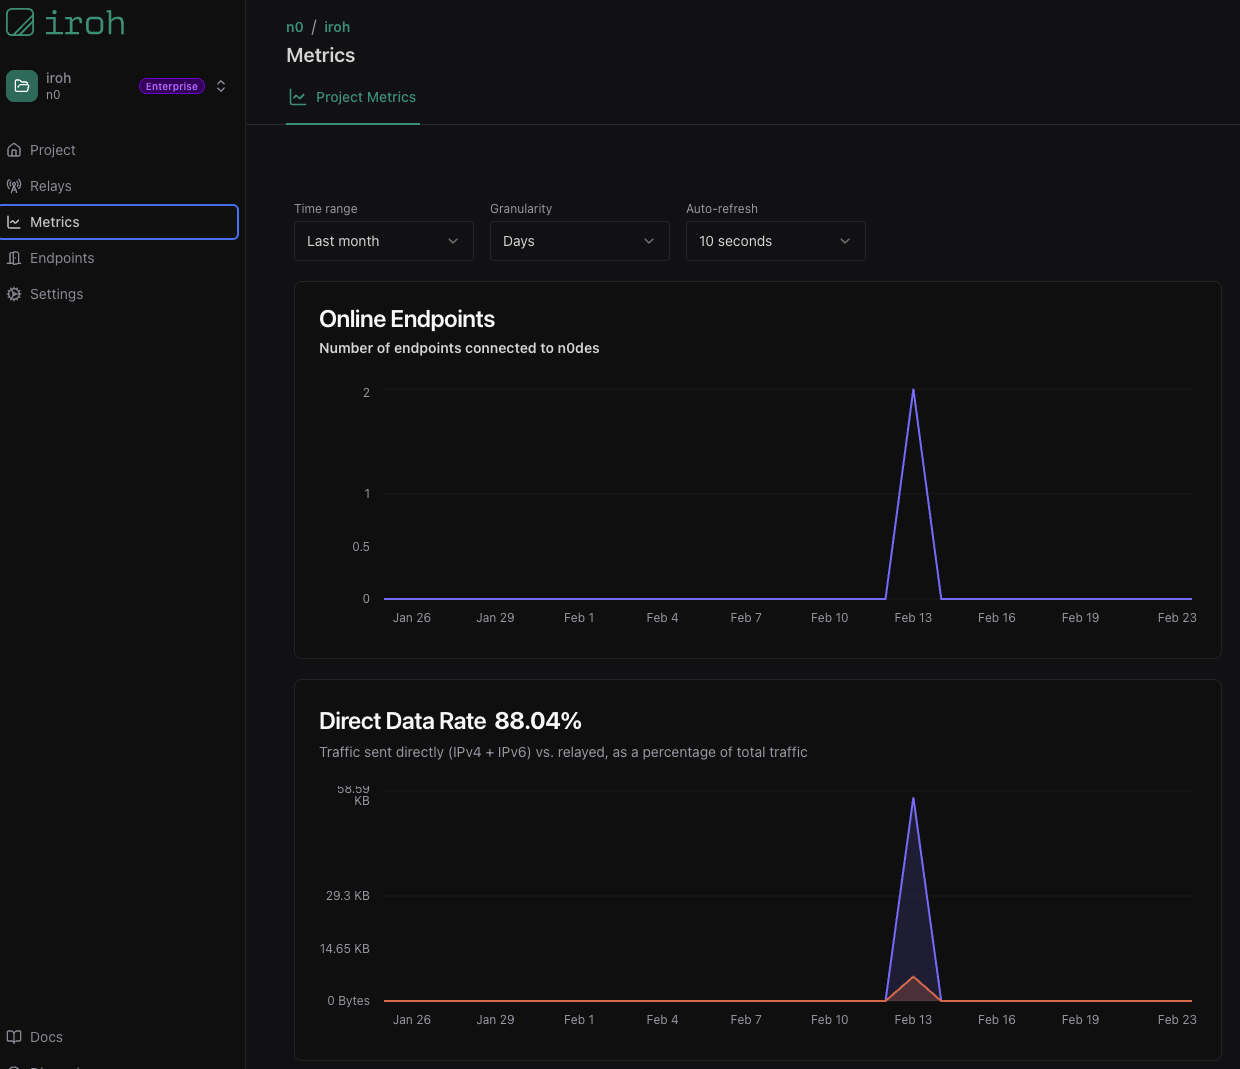
The number of endpoints currently online and connected to your project. This gives you a real-time view of your network's active nodes.
### Online Endpoints
The number of endpoints currently online and connected to your project. This gives you a real-time view of your network's active nodes.
 ### Direct Data Rate
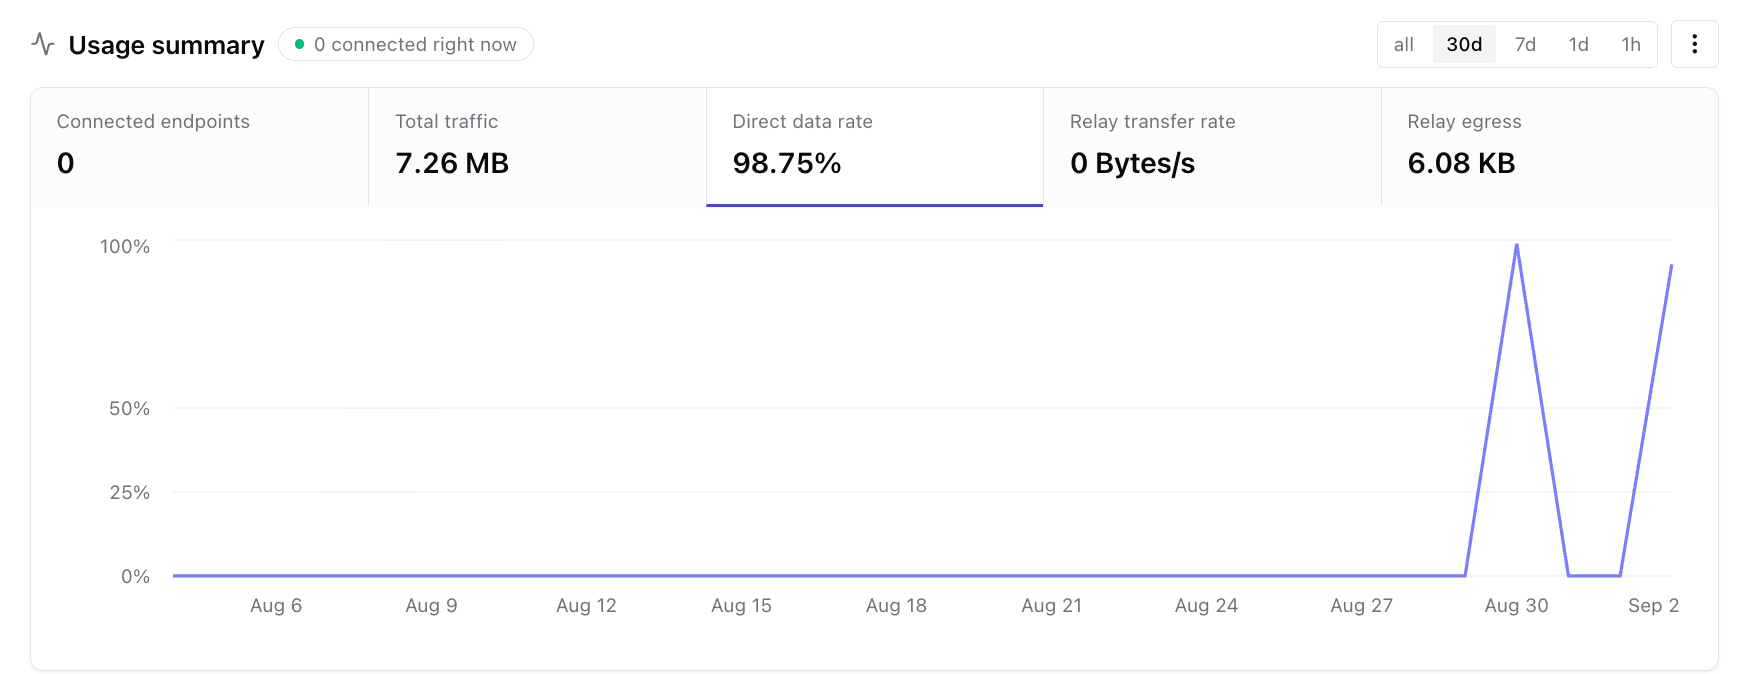
Direct data rate measures the amount of data being transferred directly between
endpoints in your network, without relaying through a server. A higher direct
data rate indicates better peer-to-peer connectivity and can lead to improved
performance and lower latency for your users.
### Direct Data Rate
Direct data rate measures the amount of data being transferred directly between
endpoints in your network, without relaying through a server. A higher direct
data rate indicates better peer-to-peer connectivity and can lead to improved
performance and lower latency for your users.
 ### Traffic Sent & Received
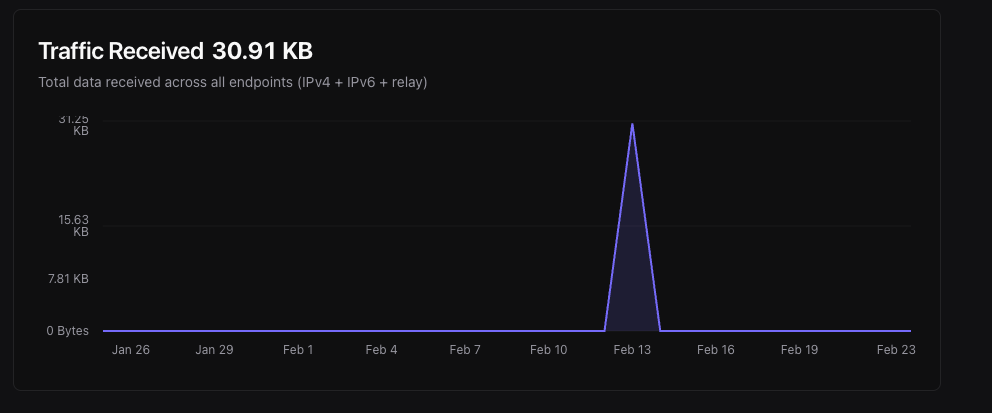
This metric tracks the amount of data being sent and received by your endpoints.
Monitoring traffic patterns can help you identify potential bottlenecks and
optimize network performance.
### Traffic Sent & Received
This metric tracks the amount of data being sent and received by your endpoints.
Monitoring traffic patterns can help you identify potential bottlenecks and
optimize network performance.
 ## Relay metrics
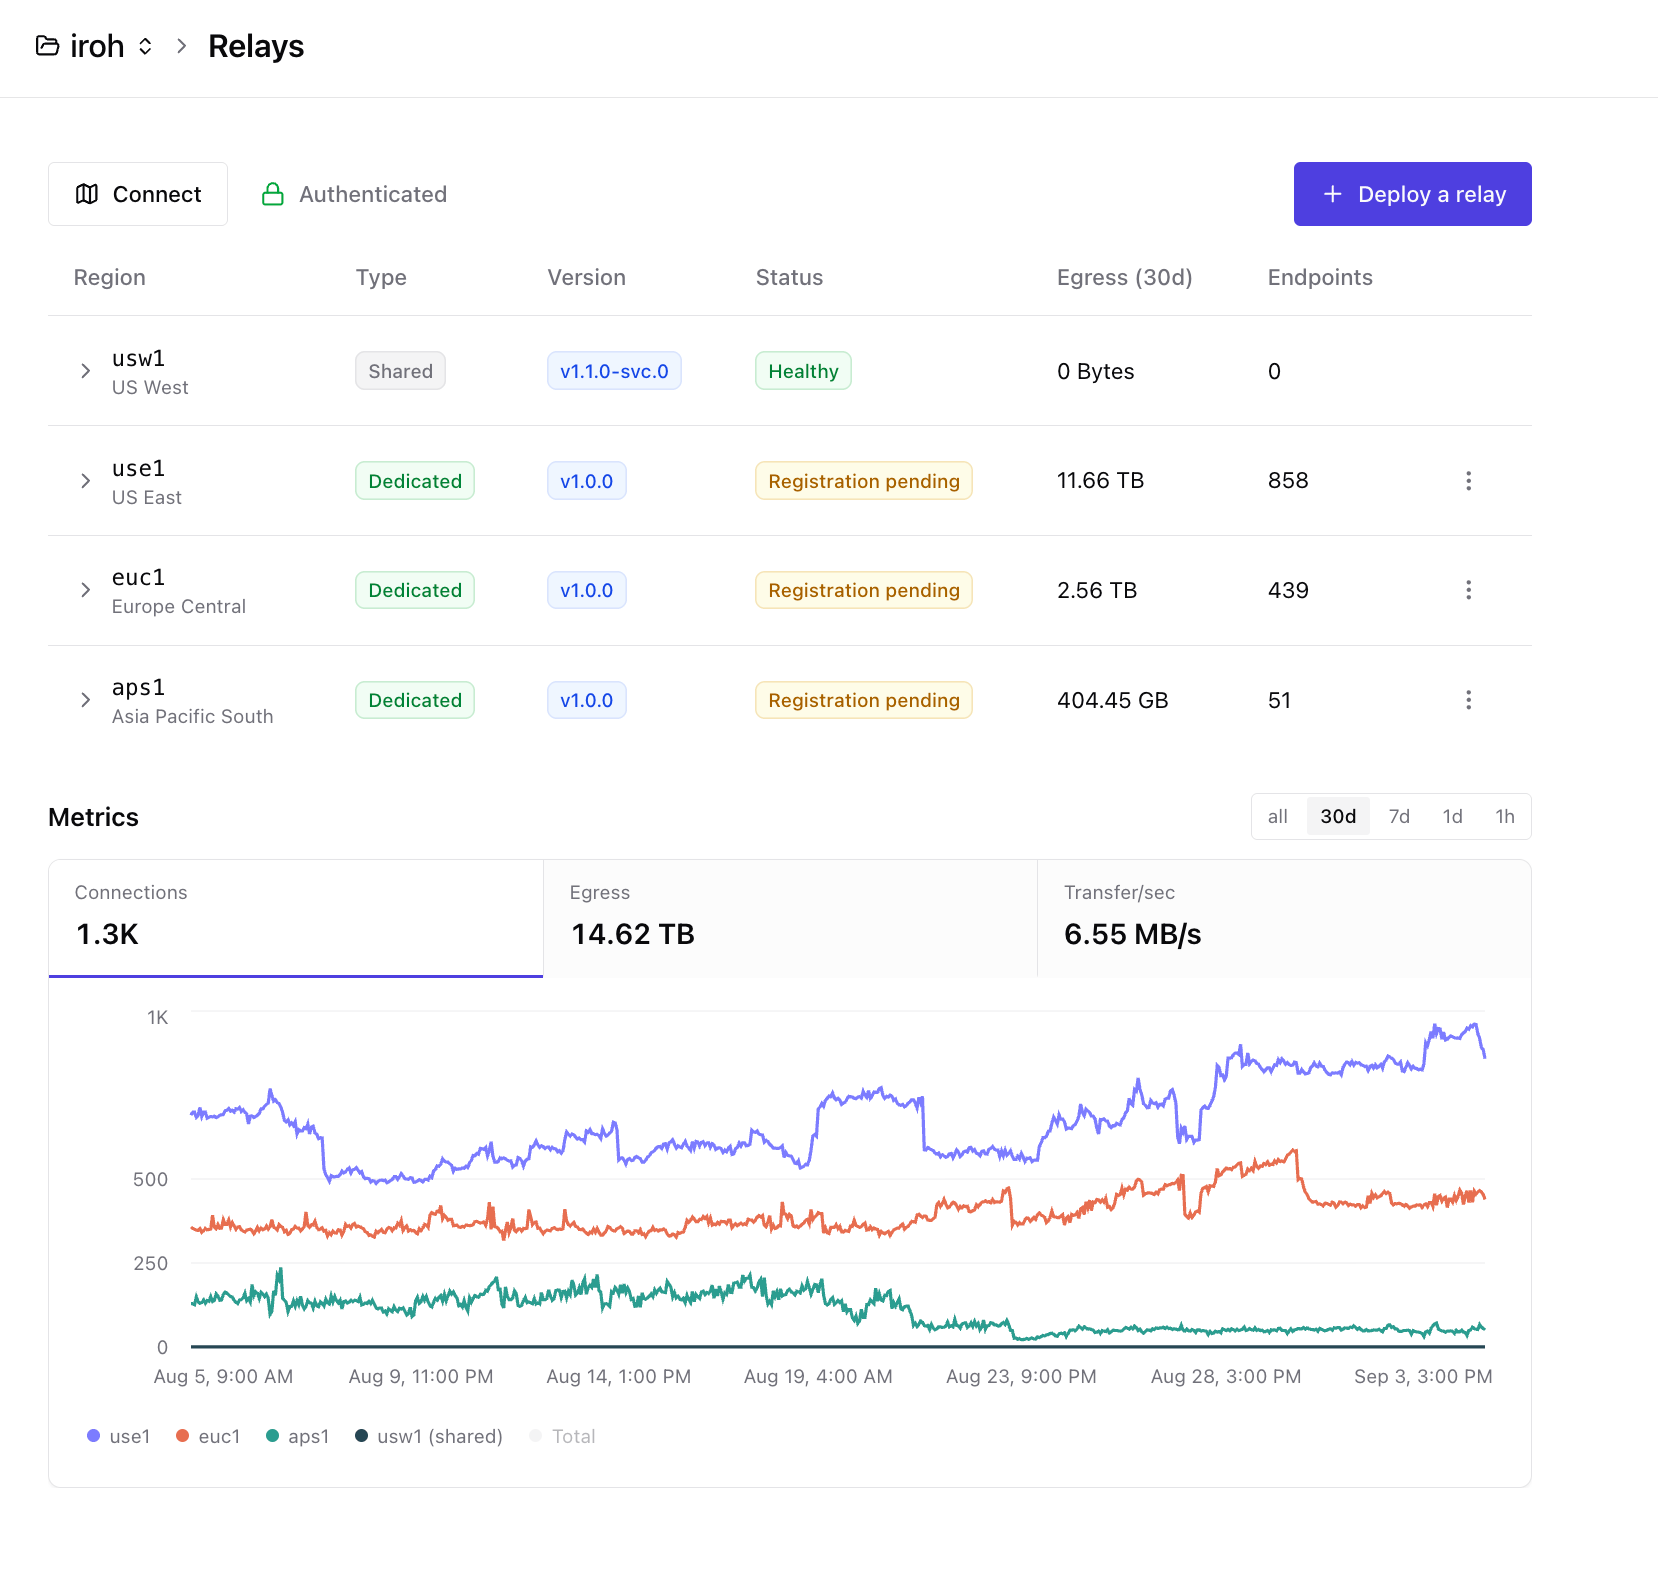
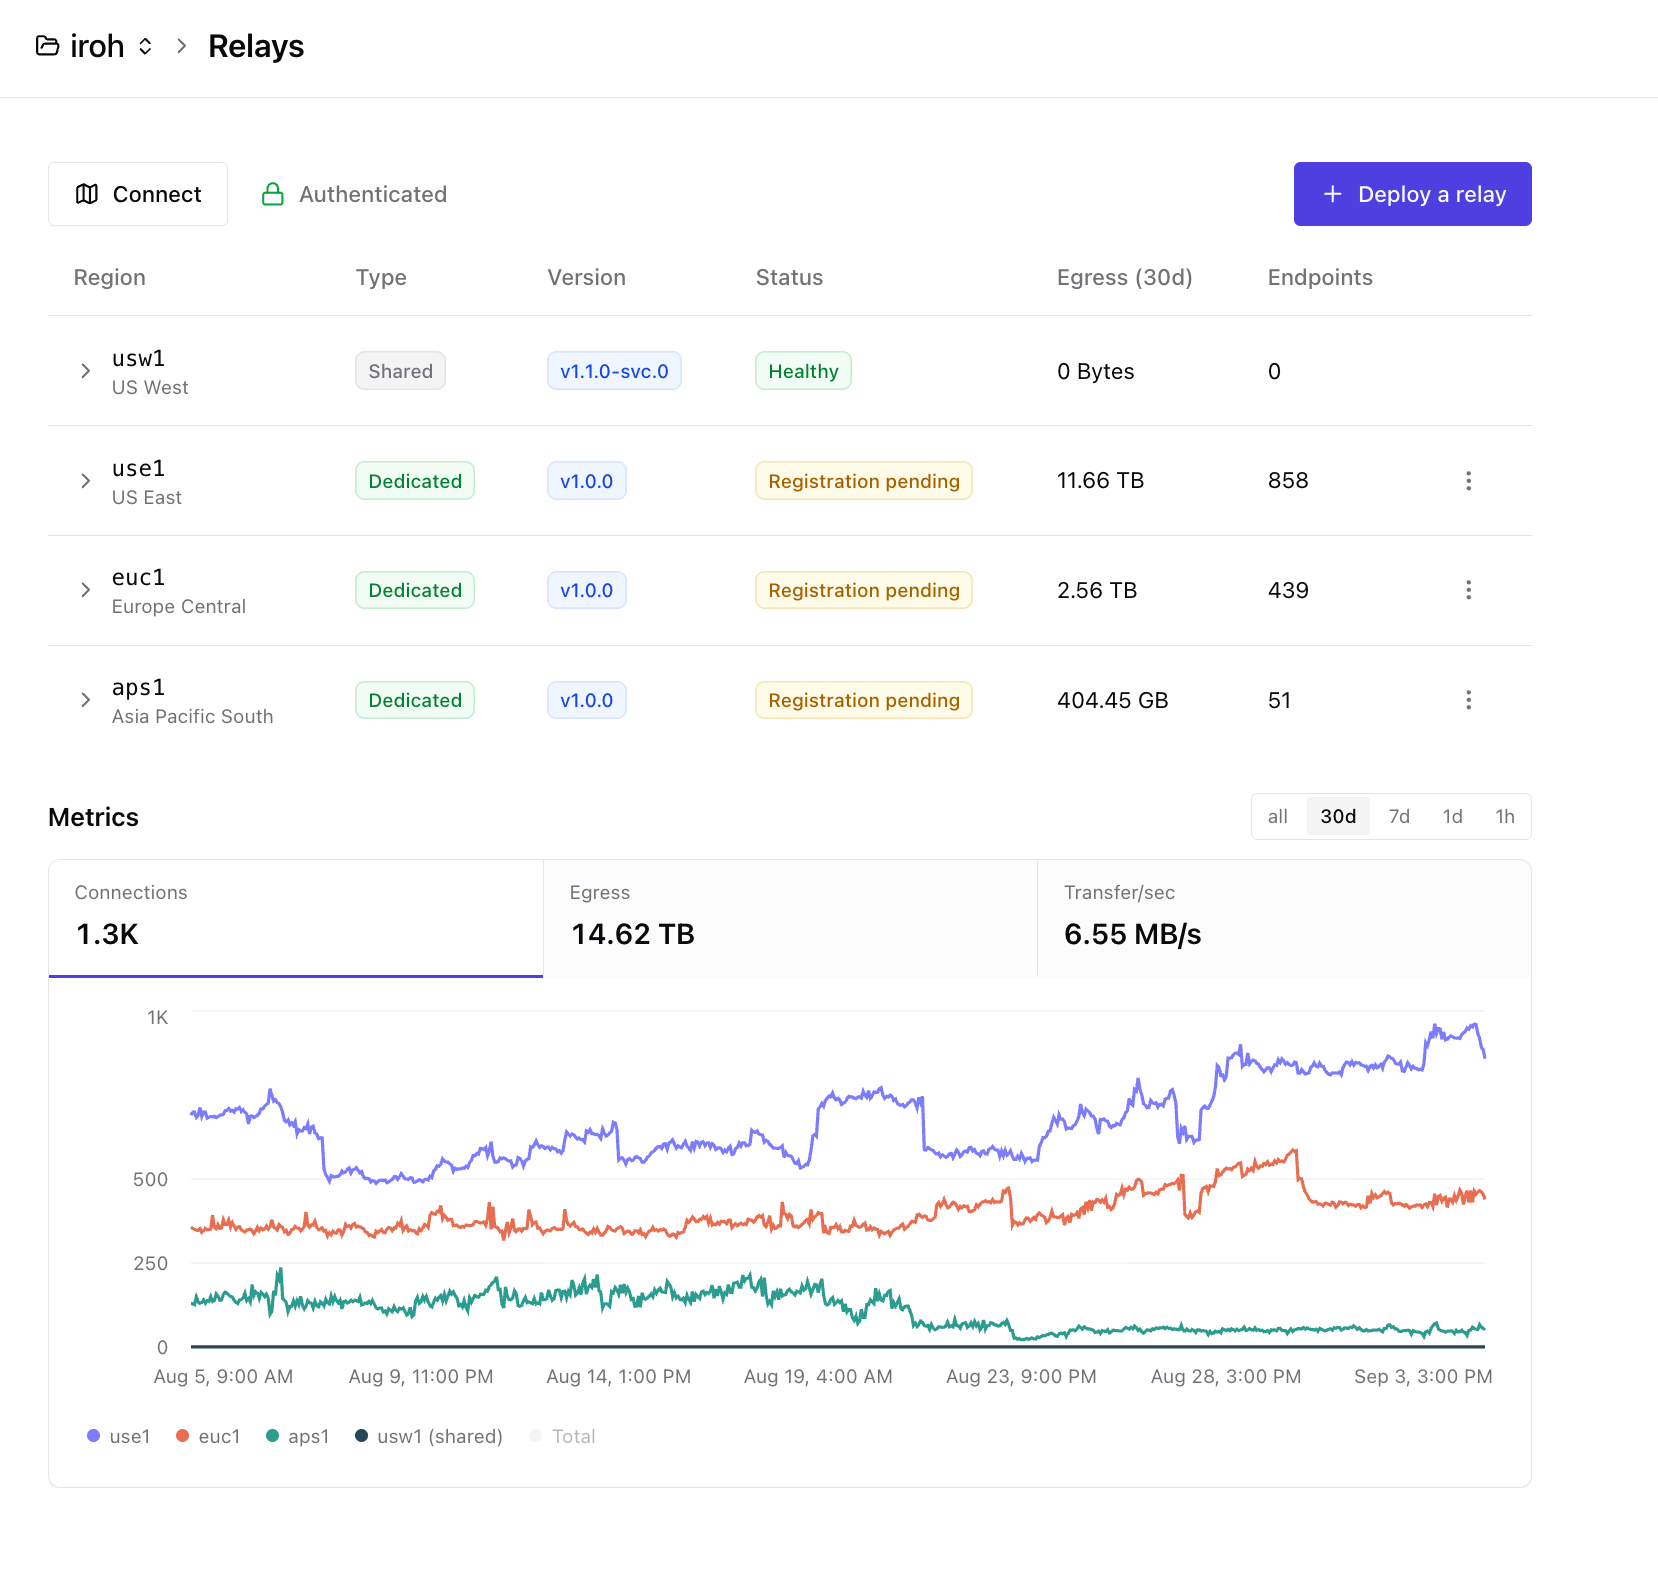
If you have dedicated relays set up for your project, you can also view metrics
related to relay performance, such as number of endpoints over time and relay data transfer.
## Relay metrics
If you have dedicated relays set up for your project, you can also view metrics
related to relay performance, such as number of endpoints over time and relay data transfer.
 ## Privacy
All metrics collected are anonymized and aggregated to ensure user privacy.
No personally identifiable information (PII) is collected or stored. The
focus is on overall network performance rather than individual user behavior.
If you have concerns about data collection, please refer to the
[privacy policy](https://services.iroh.computer/legal/privacy).
## Privacy
All metrics collected are anonymized and aggregated to ensure user privacy.
No personally identifiable information (PII) is collected or stored. The
focus is on overall network performance rather than individual user behavior.
If you have concerns about data collection, please refer to the
[privacy policy](https://services.iroh.computer/legal/privacy).