> ## Documentation Index
> Fetch the complete documentation index at: https://docs.iroh.computer/llms.txt
> Use this file to discover all available pages before exploring further.
# See your direct data rate
> Get started with Iroh Services in minutes
### What is direct data rate?
When two iroh endpoints connect, traffic either flows **directly** between them
(peer-to-peer) or gets routed through a relay server. Direct connections are
faster and cheaper. Relayed traffic adds latency and burns relay bandwidth.
**Direct data rate** is the percentage of your network's traffic flowing
directly. A **high rate** means NAT traversal is working and your users are getting
the best possible connection. A **low rate** means too much traffic is falling back
to relays, which is worth investigating.
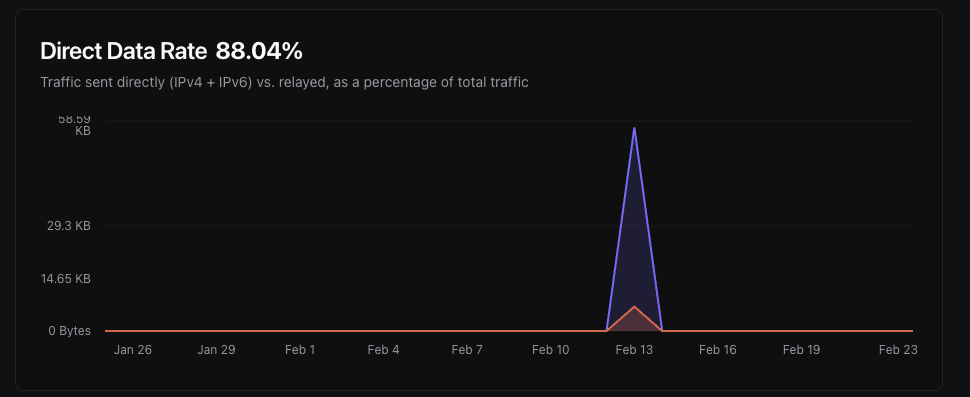 This guide walks you through hooking up your first endpoint to Iroh Services so
you can see direct data rate and other connectivity metrics for your own
network. You'll need an [Iroh Services
account](https://services.iroh.computer?utm_source=docs\&utm_content=quickstart)
with an [API key](/iroh-services/access).
### Add the Iroh Services Client
In Rust, add the `iroh-services` crate to your `Cargo.toml`:
```
cargo add iroh-services
```
The Python, Swift, and Kotlin bindings ship the services client as part of
`iroh-ffi`, with no extra dependency needed.
### Connect Your Endpoint
Then, in your code, create a client and connect your endpoint to Iroh Services. Giving the endpoint a name makes it easy to identify on the dashboard; unnamed endpoints are harder to distinguish from each other.
```rust Rust theme={null}
use iroh::{Endpoint, endpoint::presets};
use iroh_services::Client;
#[tokio::main]
async fn main() -> anyhow::Result<()> {
// Create an iroh endpoint
let endpoint = Endpoint::bind(presets::N0).await?;
// Wait for the endpoint to be online
endpoint.online().await;
// Create the Iroh Services client with your API key.
let client = Client::builder(&endpoint)
.api_secret_from_str("YOUR_API_KEY")?
.name("my-endpoint")?
.build()
.await?;
// Your endpoint is now reporting metrics to Iroh Services!
Ok(())
}
```
```python Python theme={null}
import asyncio
import iroh
async def main():
ep = await iroh.Endpoint.bind(iroh.EndpointOptions(preset=iroh.preset_n0()))
await ep.online()
client = await iroh.ServicesClient.create(
ep,
iroh.ServicesOptions(api_secret="YOUR_API_KEY", name="my-endpoint"),
)
# Your endpoint is now reporting metrics to Iroh Services!
asyncio.run(main())
```
```swift Swift theme={null}
import IrohLib
let endpoint = try await Endpoint.bind(options: EndpointOptions(preset: presetN0()))
await endpoint.online()
let client = try await ServicesClient.create(
endpoint: endpoint,
options: ServicesOptions(apiSecret: "YOUR_API_KEY", name: "my-endpoint")
)
// Your endpoint is now reporting metrics to Iroh Services!
```
```kotlin Kotlin theme={null}
import computer.iroh.*
import kotlinx.coroutines.runBlocking
fun main() = runBlocking {
val endpoint = Endpoint.bind(EndpointOptions(preset = presetN0()))
endpoint.online()
val client = ServicesClient.create(
endpoint,
ServicesOptions(apiSecret = "YOUR_API_KEY", name = "my-endpoint"),
)
// Your endpoint is now reporting metrics to Iroh Services!
}
```
### View Your Endpoint on the Dashboard
Go to your project's **Endpoints** page. You should see your endpoint listed as
online. Click on it to view details.
## Next steps
Run remote diagnostic reports on your users' endpoints to find out why connections fail.
Configure dedicated relays for your endpoints and learn why they matter for production.
Build a peer-to-peer chat application from scratch using the iroh gossip protocol.
This guide walks you through hooking up your first endpoint to Iroh Services so
you can see direct data rate and other connectivity metrics for your own
network. You'll need an [Iroh Services
account](https://services.iroh.computer?utm_source=docs\&utm_content=quickstart)
with an [API key](/iroh-services/access).
### Add the Iroh Services Client
In Rust, add the `iroh-services` crate to your `Cargo.toml`:
```
cargo add iroh-services
```
The Python, Swift, and Kotlin bindings ship the services client as part of
`iroh-ffi`, with no extra dependency needed.
### Connect Your Endpoint
Then, in your code, create a client and connect your endpoint to Iroh Services. Giving the endpoint a name makes it easy to identify on the dashboard; unnamed endpoints are harder to distinguish from each other.
```rust Rust theme={null}
use iroh::{Endpoint, endpoint::presets};
use iroh_services::Client;
#[tokio::main]
async fn main() -> anyhow::Result<()> {
// Create an iroh endpoint
let endpoint = Endpoint::bind(presets::N0).await?;
// Wait for the endpoint to be online
endpoint.online().await;
// Create the Iroh Services client with your API key.
let client = Client::builder(&endpoint)
.api_secret_from_str("YOUR_API_KEY")?
.name("my-endpoint")?
.build()
.await?;
// Your endpoint is now reporting metrics to Iroh Services!
Ok(())
}
```
```python Python theme={null}
import asyncio
import iroh
async def main():
ep = await iroh.Endpoint.bind(iroh.EndpointOptions(preset=iroh.preset_n0()))
await ep.online()
client = await iroh.ServicesClient.create(
ep,
iroh.ServicesOptions(api_secret="YOUR_API_KEY", name="my-endpoint"),
)
# Your endpoint is now reporting metrics to Iroh Services!
asyncio.run(main())
```
```swift Swift theme={null}
import IrohLib
let endpoint = try await Endpoint.bind(options: EndpointOptions(preset: presetN0()))
await endpoint.online()
let client = try await ServicesClient.create(
endpoint: endpoint,
options: ServicesOptions(apiSecret: "YOUR_API_KEY", name: "my-endpoint")
)
// Your endpoint is now reporting metrics to Iroh Services!
```
```kotlin Kotlin theme={null}
import computer.iroh.*
import kotlinx.coroutines.runBlocking
fun main() = runBlocking {
val endpoint = Endpoint.bind(EndpointOptions(preset = presetN0()))
endpoint.online()
val client = ServicesClient.create(
endpoint,
ServicesOptions(apiSecret = "YOUR_API_KEY", name = "my-endpoint"),
)
// Your endpoint is now reporting metrics to Iroh Services!
}
```
### View Your Endpoint on the Dashboard
Go to your project's **Endpoints** page. You should see your endpoint listed as
online. Click on it to view details.
## Next steps
Run remote diagnostic reports on your users' endpoints to find out why connections fail.
Configure dedicated relays for your endpoints and learn why they matter for production.
Build a peer-to-peer chat application from scratch using the iroh gossip protocol.