Project metrics
All endpoint metrics are aggregated at the project level, to provide insights into overall network performance. This aggregated data helps in understanding trends and patterns without exposing individual endpoint details.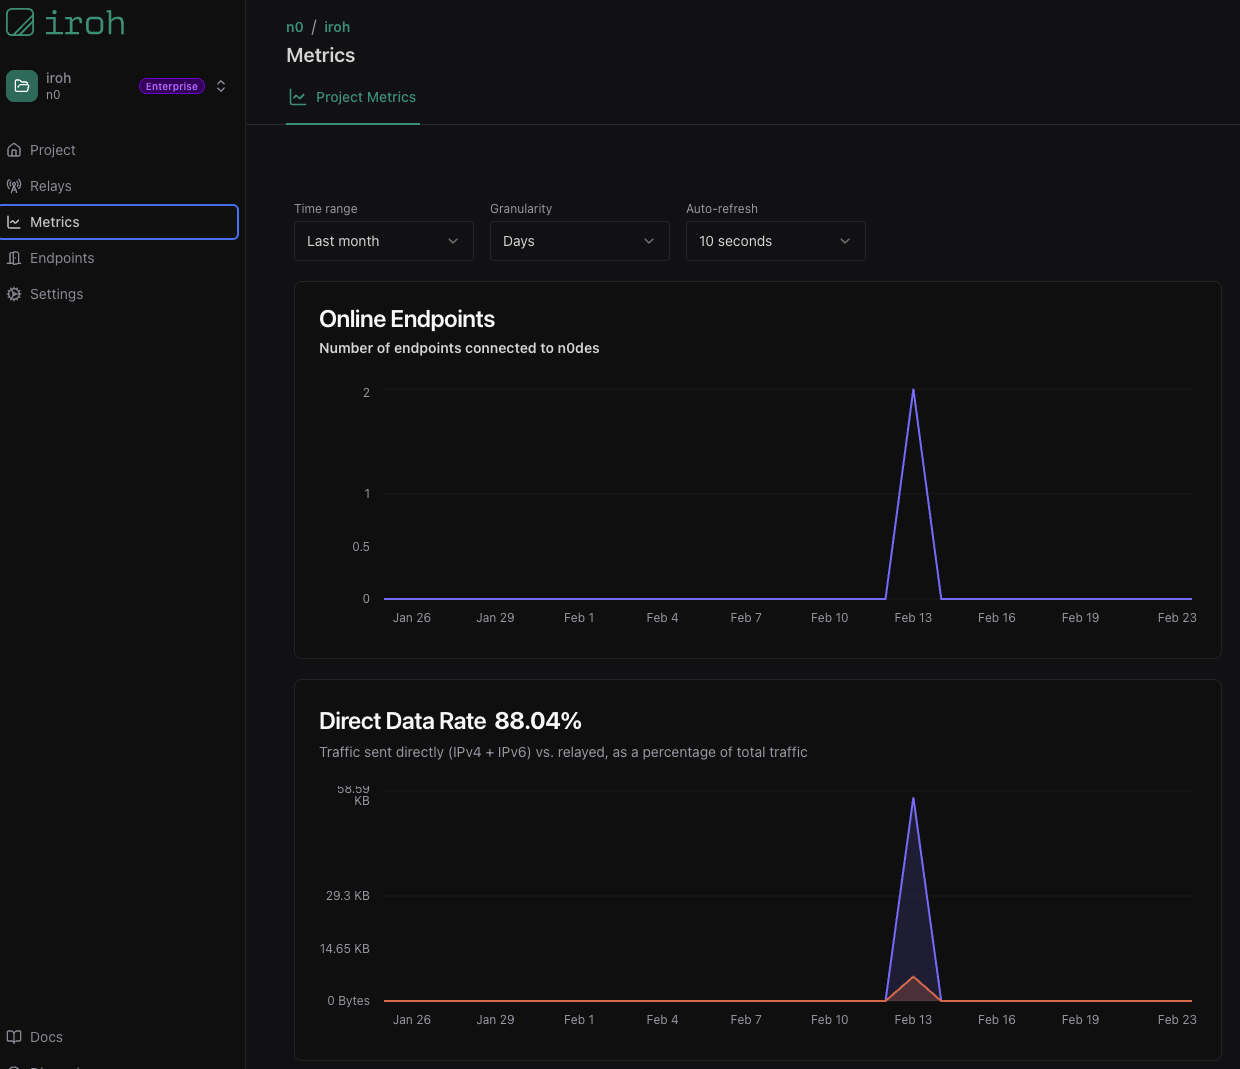
Online Endpoints
The number of endpoints currently online and connected to your project. This gives you a real-time view of your network’s active nodes.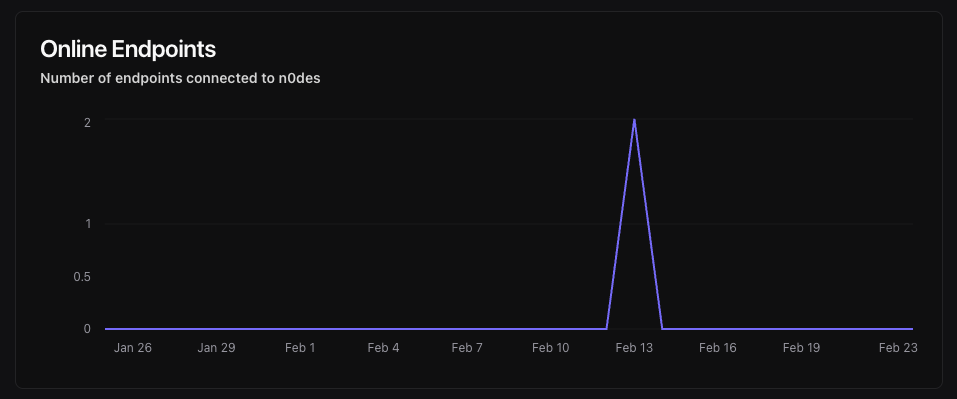
Direct Data Rate
Direct data rate measures the amount of data being transferred directly between endpoints in your network, without relaying through a server. A higher direct data rate indicates better peer-to-peer connectivity and can lead to improved performance and lower latency for your users.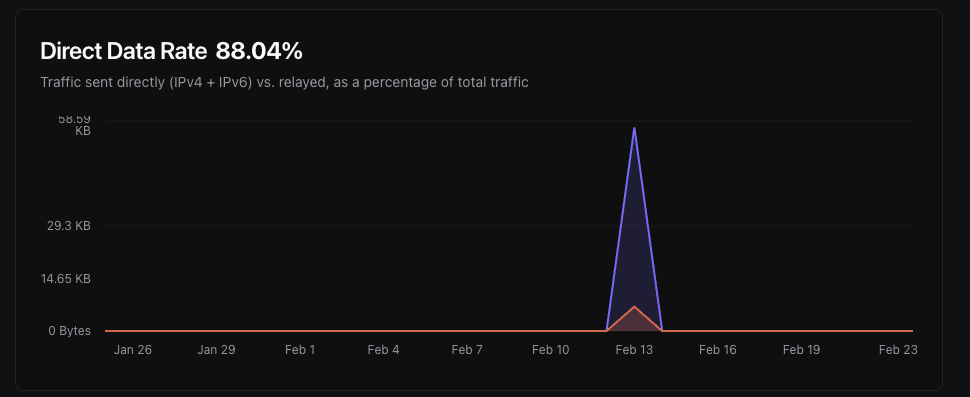
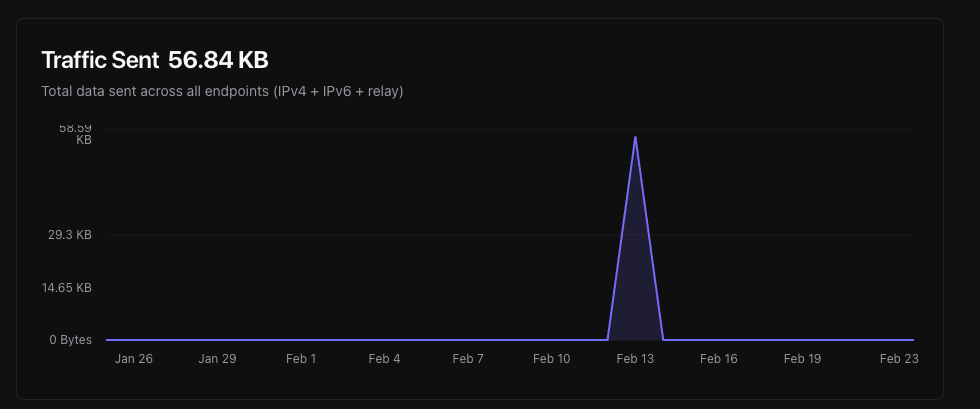
Traffic Sent & Received
This metric tracks the amount of data being sent and received by your endpoints. Monitoring traffic patterns can help you identify potential bottlenecks and optimize network performance.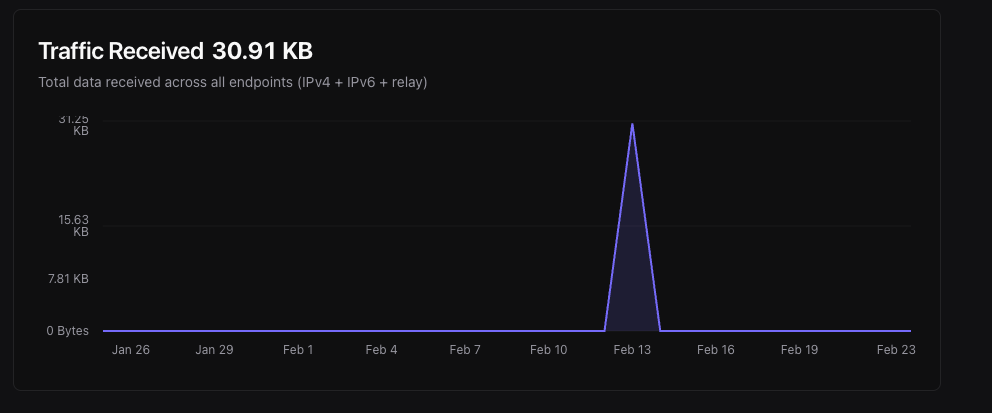
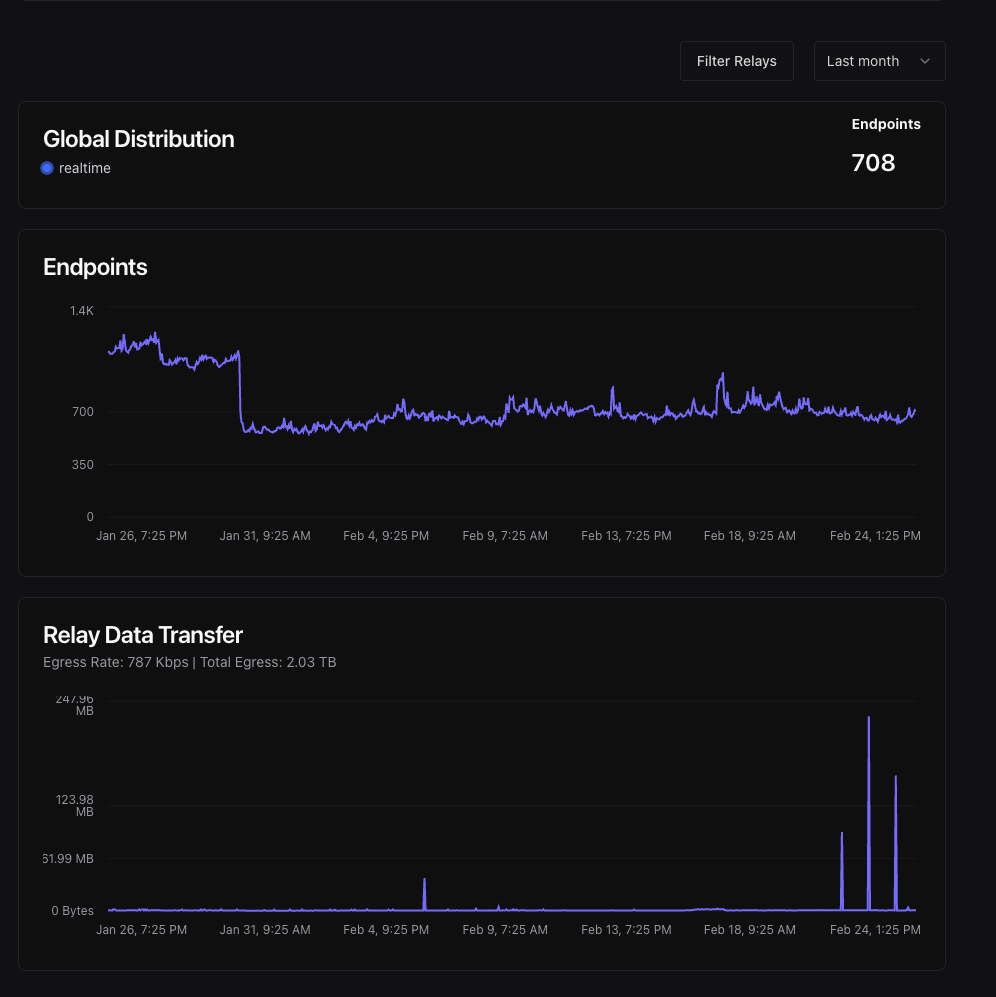
Relay metrics
If you have dedicated relays set up for your project, you can also view metrics related to relay performance, such as number of endpoints over time and relay data transfer.